Welcome to Bovine EpiMap Explorer
This app allows interactive exploration of genome-wide DNA methylation patterns in dairy cattle. You can upload your own data or visualize the most important methylation patterns related to Age-related analysis, Fertility issues, Mastitis, Interindividual variability, and Age-associated mitochondrial methylation, and more. Filter by chromosome, annotation, gene, q-value, correlation, standard deviation or methylation difference. Dynamic plots: density plot, genome browser, volcano, boxplots, pie chart and venn diagram. Additional datasets and features will be progressively integrated as they become available.
- Flexible dataset and filter selection
- Chromosome, annotation, gene filters and more
- Download filtered table
- Interactive graphics for all main visualizations
- Upload methylation datasets
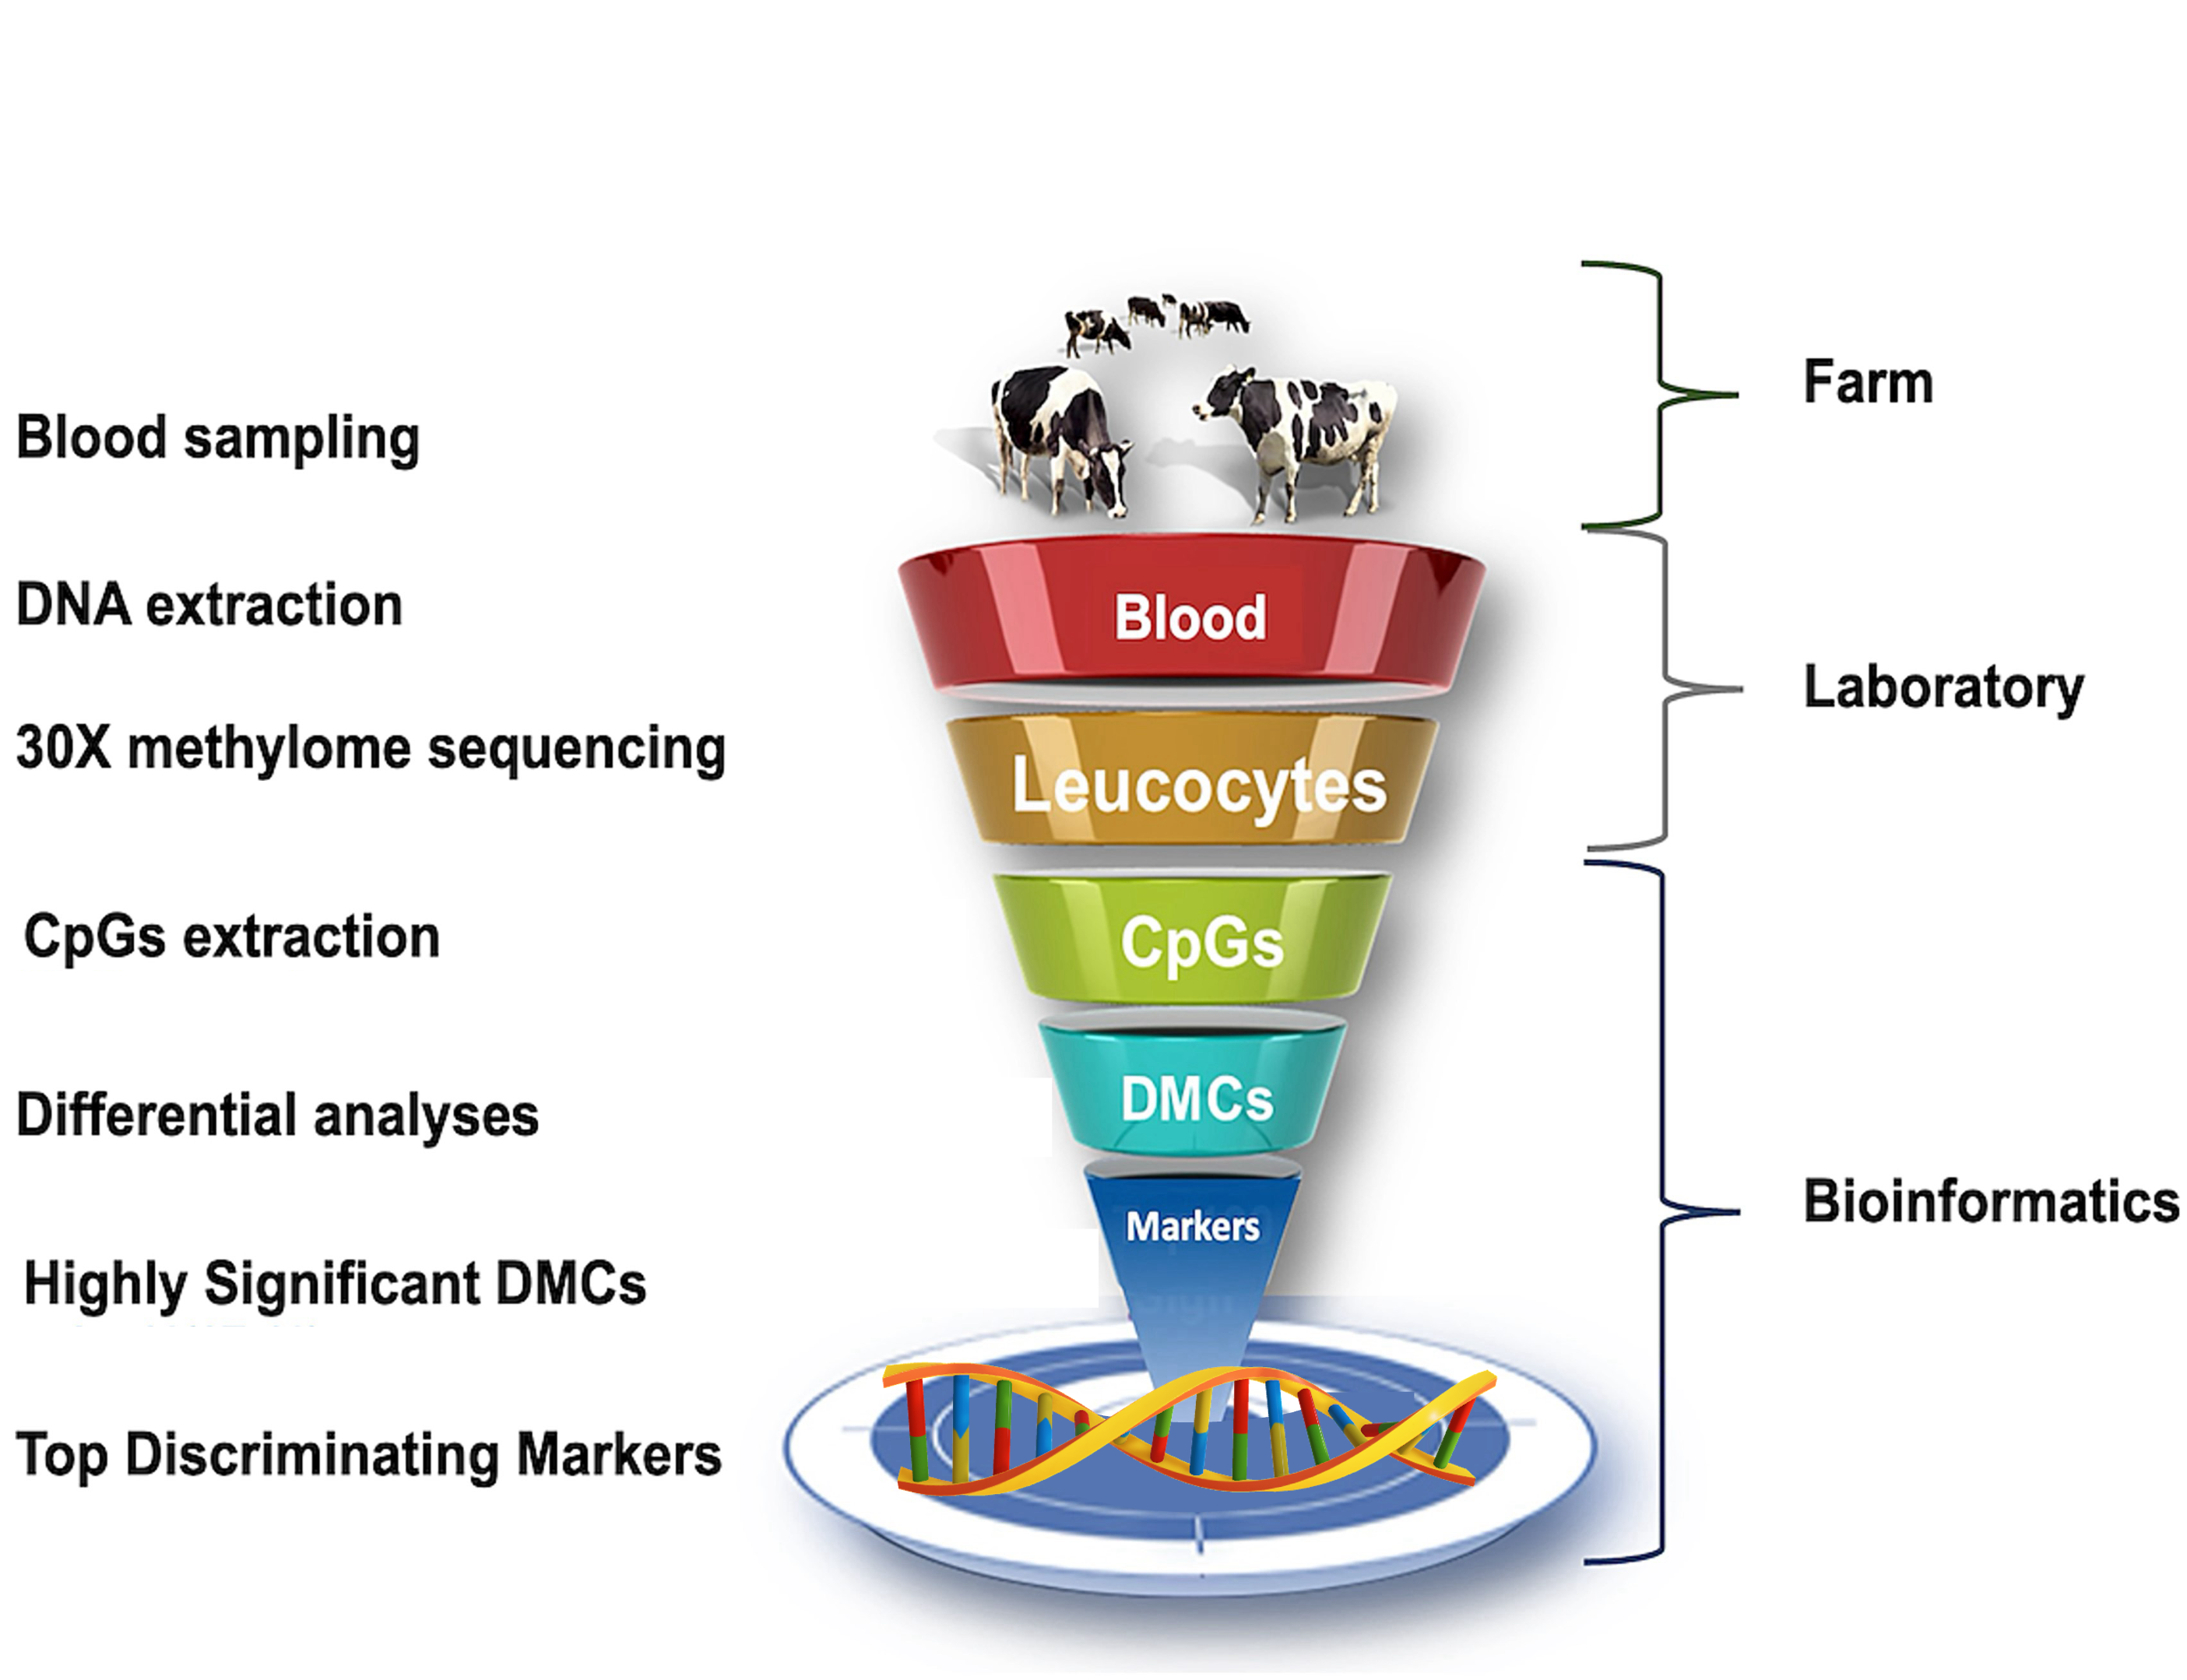
The image is subject to copyright ©: Biol Reprod, ioaf020, https://doi.org/10.1093/biolre/ioaf020.
Developed by Lotfi Bouzeraa The Sirard Lab, Université Laval | Contact: lotfi.bouzeraa.1@ulaval.ca
Required columns
- chromosome, start, end,SYMBOL, geneId, qvalue, meth.diff, MeanMeth_Group1, MeanMeth_Group2, annot_large
- For more details, please download the CSV template.
Notes
Files not matching the required structure will be rejected with an explicit message.
Materials and Methods
Experimental Design
Ethical Approval and Consent
Ethical approval to conduct the study was provided by the Animal Protection and Ethics Committee of Agriculture and Agri-Food Canada (approval number [A20-0196]). The study adhered to the guidelines set by the Canadian Council on Animal Care.
Animal Selection and Sample Collection
Blood samples were collected from cows at a British Columbia farm between November 2020 and January 2021. One year later, we retrospectively identified cows that had been culled due to fertility issues, mastitis, metabolic disorders, lameness, conditions that were not apparent at the time of sampling. The reasons for culling were documented in the farm’s management records and represented the primary cause of removal. These animals comprised the 'affected group.' For comparison, a 'control group' was selected from cows that remained in the herd without any reported health problems. The age range of cows in both groups was between 1 and 9 years. Additional samples and datasets will be incorporated as they become available.
Enzymatic Methyl Sequencing
One mL of blood from each cow was sent to the Génome Québec sequencing platform for DNA extraction, enzymatic methyl-seq (EM-seq) library preparation, and whole-genome sequencing. Libraries were pooled at equimolar concentrations and sequenced using Illumina NovaSeq technology, generating approximately 450 million 150-bp paired-end reads per library.
During library preparation, there is a DNA conversion step that involves three primary enzymes: TET2 and T4-BGT detect and transform 5mC and 5hmC into a product that cannot be deaminated by the APOBEC3A enzyme. Subsequently, APOBEC3A deaminates unmodified cytosines by converting them to uracils. As a result, unmethylated cytosines are transformed into uracils and then into thymines during polymerase chain reaction (PCR) amplification, while methylated cytosines remain as cytosines. To verify the extent of DNA conversion of each sample, two internal controls were added before the conversion step: unmethylated lambda and CpG methylated pUC19. By estimating the methylation levels of lambda and pUC19, we assess the quality of DNA conversion.
Methyl Calling
Reads were filtered, trimmed, and deduplicated using fastp version 0.23.1 with default parameters. Read conversion, alignment to the Bos taurus reference genome (ARS-UCD1.2.104), and methyl calling were conducted using Bismark. This process was implemented in the DRAGEN Methylation Pipeline, which was run on an Illumina DRAGEN server using default parameters. In brief, reads from the EM-seq library were converted into both a C-to-T and G-to-A version and then aligned to a correspondingly converted reference genome. This approach ensured that sites from both DNA strands were captured. Methyl calling was achieved by comparing the originally sequenced read with its corresponding original reference genome.
Annotation
Differentially methylated sites or regions were linked to adjacent genes or the closest genes using the annotatePeak function in the default mode of the R package ChIPseeker (version 1.38.1). Depending on the location relative to the closest gene, each annotated site or region was categorized as “TSS Shores (−3 kb to +3 kb relative to the TSS)” or “Promoter (−3 kb upstream of the TSS),” “5’ UTR,” “3’ UTR,” “Exonic,” “Intronic,” “Downstream,” or “Distal intergenic.” For these analyses, the reference genome used was Bos_taurus.ARS-UCD1.2 from Ensembl (version 108) with supplementary genomic annotations provided by the org.Bt.eg.db package (version 3.18.0). Note: Distal intergenic positions (~60%) were removed from the interindividual variability dataset to improve application performance.
Differential Methylation Analysis: Mitochondrial Epigenome
Differential methylation analysis was performed at both the cytosine (site-specific) and regional levels using the MethylKit package (version 1.28.0). Methylation data obtained from Bismark alignments were filtered to retain CpG, CHH, and CHG sites covered by at least five reads in a minimum of ten samples per group. For each site, a logistic regression model was used to compute p-values, which were subsequently adjusted to q-values using the SLIM method. To account for potential differences in bisulfite conversion efficiency, the methylation level of lambda phage DNA in the CpG context was included as a covariate.Methylation differences were calculated as the difference between the mean methylation level in young animal controls (n = 20; 2.9 to 5.8 years) and that in adult controls (n = 20; 6.5 to 9.1 years). Only sites with q-values below 0.05 were considered significant for downstream analyses.
Differential Methylation Analysis : Nuclear Epigenome
Differential methylation analysis was conducted for individual cytosines and for regions using the R package MethylKit (version 1.28.0, ). Methylation calls from Bismark were filtered to retain CpG sites covered by at least six reads. For each CpG site, a logistic regression model was fitted to calculate p-values. These p-values were then adjusted to q-values using the SLIM method without making corrections for overdispersion. The methylation level of lambda in the CpG context was included as a covariate in the analysis to adjust for disparities in conversion rates between samples. Methylation differences were calculated as: mean methylation level in affected group minus mean methylation level in control group.Our analysis focused on CpG sites with q-values less than 0.01 and methylation differences greater than the absolute value of 25 %. These cutoffs were chosen based on commonly accepted thresholds to balance false discovery rates and biological significance.
Resources
- Bouzeraa and Sirard (2026). Bovine EpiMap Explorer: An interactive web application for bovine epigenomic data. *BMC Bioinformatics*. 2026 Mar 6.
- Bouzeraa et al. (2025). Changes in Nuclear and Mitochondrial DNA Methylation in Cow Blood Associated with Age and Disease. *Epigenetics* 20(1):2598087.
- Bouzeraa et al. (2025). Building a Bovine Blood Genomic DNA Methylation EpiMap Related to Disease Phenotypes. *BMC Genomics* 26, 932 (2025).
- Bouzeraa et al. (2025). Epigenetic insights into fertility: involvement of immune cell methylation in dairy cows reproduction. *Biology of Reproduction*, ioaf020.
- Bouzeraa et al. (2024). Decoding epigenetic markers: implications of traits and genes through DNA methylation in resilience and susceptibility to mastitis in dairy cows. *Epigenetics*, 19(1):2391602.
© 2026 Lotfi Bouzeraa, The Sirard Lab – All visualizations and datasets are protected by copyright. Unauthorized reuse without proper citation is prohibited. Downloading implies acceptance of these terms.
About Bovine EpiMap Explorer
Bovine EpiMap Explorer is an interactive web application designed to explore genome-wide DNA methylation patterns in cattle. The app allows users to visualize, filter, and download methylation data across different biological contexts (age, fertility, mastitis, etc.) with a simple and intuitive interface.
Mission
Our mission is to provide easy and interactive access to bovine DNA methylation data. This tool is designed to democratize epigenomic data exploration, accelerate research, and support new discoveries in animal health and epigenetics.
Who is this for?
Researchers, bioinformaticians, geneticists, epigeneticists, veterinarians, and students interested in cattle genomics and epigenetics.
Datasets Included
- Processed data from whole-genome enzymatic methyl-seq of Prim’Holstein cows, including: 48 healthy cows for age-related analysis; 12 samples for fertility issues (6 fertile vs 6 subfertile); 12 samples for mastitis (6 affected vs 6 controls); 60 samples for interindividual variability (30 healthy, 6 mastitis, 6 fertility issues, 6 lameness, 12 metabolic disorders); and 40 healthy cows for mitochondrial methylation related to age (contexts: CpG, CHH, and CHG). Additional datasets will be progressively integrated as new data become available.
- Gene annotations, genomic context, and methylation metrics.
How does it work?
- Select the dataset you want to explore.
- Apply filters such as chromosome, start and end regions, annotation type, gene symbol, q-value, correlation or methylation difference to focus on regions or features of interest.
- Visualize the filtered data using the following interactive plots:
- Data Table: View and download the filtered table.
- Density Plot: Explore the distribution of methylation levels.
- Genome Browser: Navigate methylation levels along the genome, with gene tracks and smooth visualization. Mouseover gene tracks to display gene names and coordinates.
- Volcano Plot: Visualize differentially methylated positions (meth.diff vs. -log10(q-value)).
- Boxplots: Compare methylation by group.
- Pie chart: Compare genomic context distribution.
- Data Intersection: Implements an interactive Venn diagram interface.
- Download the filtered data table for further analysis.
- Upload your own methylation datasets to perform interactive exploration.
Tips:
- Use the zoom and tooltip features in interactive plots to focus on regions or data points of interest.
- If the dataset is large, the app will automatically downsample plots for smoother display.
- Filters and plots automatically update after clicking 'Update View'.
Technologies
- R / Shiny framework
- Interactive web design
- Processed with custom and open-source bioinformatics pipelines
Citation
For more details or if you use Bovine EpiMap Explorer in your research, please cite:
Contact & Acknowledgements
Development: Lotfi Bouzeraa, Université Laval
Scientific advisor: Marc-André Sirard, Université Laval
For questions, feedback, or collaboration, contact: lotfi.bouzeraa.1@ulaval.ca, Marc-Andre.Sirard@fsaa.ulaval.ca
We thank Genome Canada, Genome Quebec, Université Laval, the Sirard Lab, and all contributors and collaborators.
Resources
- Bouzeraa et al. (2025). Changes in Nuclear and Mitochondrial DNA Methylation in Cow Blood Associated with Age and Disease. *Epigenetics* 20(1):2598087.
- Bouzeraa et al. (2025). Building a Bovine Blood Genomic DNA Methylation EpiMap Related to Disease Phenotypes. *BMC Genomics* 26, 932 (2025).
- Bouzeraa et al. (2025). Epigenetic insights into fertility: involvement of immune cell methylation in dairy cows reproduction. *Biology of Reproduction*, ioaf020.
- Bouzeraa et al. (2024). Decoding epigenetic markers: implications of traits and genes through DNA methylation in resilience and susceptibility to mastitis in dairy cows. *Epigenetics*, 19(1):2391602.
© 2026 Lotfi Bouzeraa, The Sirard Lab – All visualizations and datasets are protected by copyright. Unauthorized reuse without proper citation is prohibited. Downloading implies acceptance of these terms.